We use the verb “feel” in the absence of an equation to prove the value of martech. Martech utilisation taps into the need to get an answer to “Are we getting value from our martech stack? There is a metric that correlates the company revenue-per-employee ratio and martech maturity…
“Are we getting value from our martech stack?” That is the million dollar question many CMOs, and CIOs ask. It’s the right question to ask but not easy to answer.
Marketing departments are getting better at demonstrating campaign ROI and attribution. But what about martech? ROI is well suited for calculating short-term results like campaigns, projects, or implementations. However, martech investments support long-term results like architecture and IT infrastructure. The martech business cases are often ROI calculations based on saving resources and costs, ie. efficiency. Efficiency is a good way, but not the best way to ‘sell’ martech internally.
Efficiency is about
- doing things right
- saving money
- focused on the company
Effectiveness is about
- doing the right things
- making money
- focused on the customer
Don’t get me wrong, efficiency is great, but effectiveness is better. It is great we are saving resources, but to get the board room’s attention you’ll have to talk about company value. Many company boardrooms feel they do not get value from the martech stack. We use the verb “feel” in the absence of an equation to prove the value of martech.
Some CIOs and CMOs look at the utilisation of martech, as a kind of proxy for martech value. A recent Gartner report reveals that companies only “utilise” 33% of their martech capabilities. Martech utilisation taps into the need to get an answer to “Are we getting value from our martech stack? However, defining what is ‘good or poor utilisation’ is hard, let alone calculating it.
For instance, is frequent use of a feature good or poor utilisation?
Is a press release tool underutilised when only used for crisis management once in three years when glass particles are found in baby food?
Is daily use of an email messaging tool a good thing, if conversion rates drop because of email fatigue by certain audiences?
Just like with ROI, utilisation focuses on the use of software, i.e. efficiency, instead of the value it creates for the company.
How Martech Relates to Company Value
For the past five years, we have investigated the interplay between many data points like vendor and stack size, revenue, headcount, industry, business model, and specific martech components. We found a metric that correlates the company revenue-per-employee ratio and martech maturity. It is only a start, but it is already very promising and insightful.
We have conducted hundreds of data experiments with a team of data scientists, utilising our martech data warehouse. The warehouse contains 14,106 customer technology tools, 1,133 global, real-life, cross-industry customer technology stacks, and 4,538 requirements. It is continuously curated by more than 467 experts across 30 countries.
The Performance-Maturity Equation
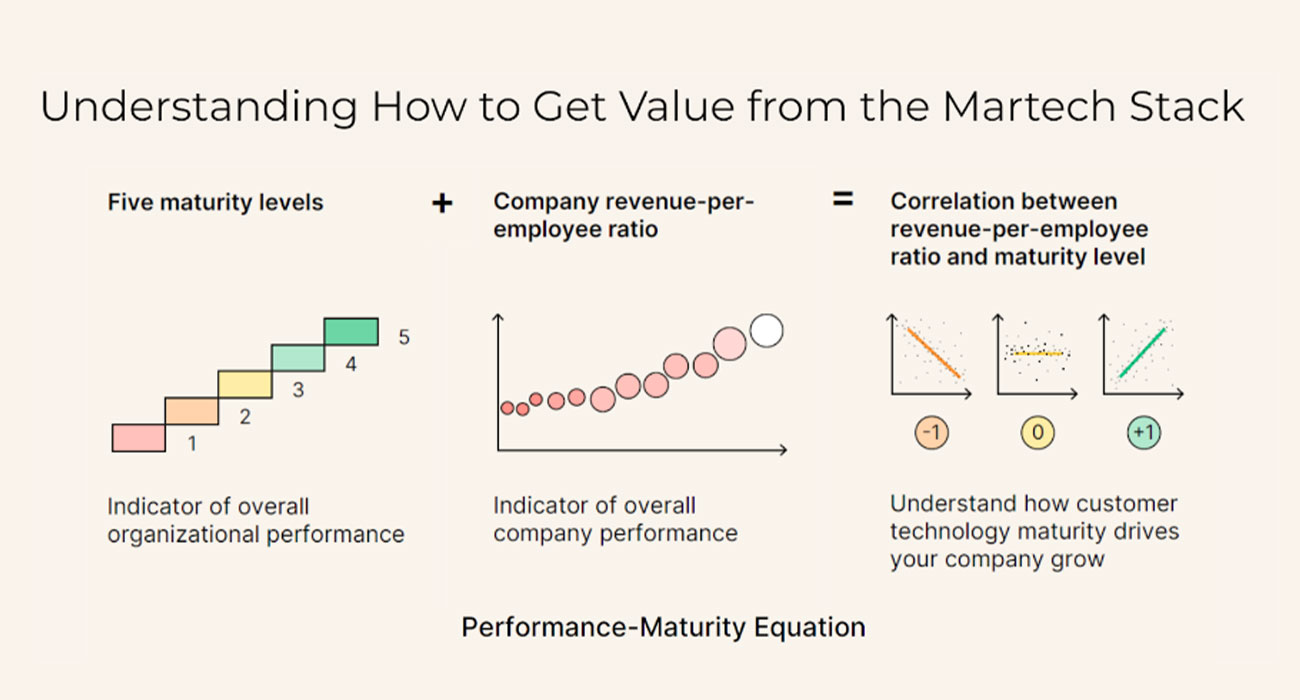
The State of Martech 2024 – Scott Brinker & Frans Riemersma., 7th May 2024, page 51
The metric is a correlation between internal and external company performance.
- Internal company performance is measured by self-reported maturity for the different martech. The maturity model is a Likert scale based on the Capability Maturity Model from Carnegie Mellon University.
- External company performance is measured by the revenue/employee ratio, sourced from annual reports.
The correlation between the two indicates how the maturity and revenue/employee ratio change together in a particular pattern. It does not specify why this happens or if one causes the other. Correlation is not causation, as market conditions, industry trends, company acquisitions, or regulatory changes impact both metrics simultaneously. Therefore this metric should be regarded as a directional cue. It is useful to drive thoughtful conversations.
If we focus on outperformers in separate industries we can see what they do and learn what practices they follow. We can see where they invest and where they divest. This does not imply that you should blindly copy and paste their stacks. The outcomes should still be translated into your business context.
Outperformers are the top 30% ranking companies in one industry based on their revenue-per-employee ratio. It is remarkable to see that outperformers tend to suffer much less from cognitive bias concerning their maturity than the low 70% of performers (see The State of Martech 2024, pages 52-54). The Dunning-Kruger effect tells us that the lower 70% probably think they’re better at leveraging martech effectively and efficiently than they actually are. Whereas the top 30% have become more realistic in their ways as they have “learned their lessons’.
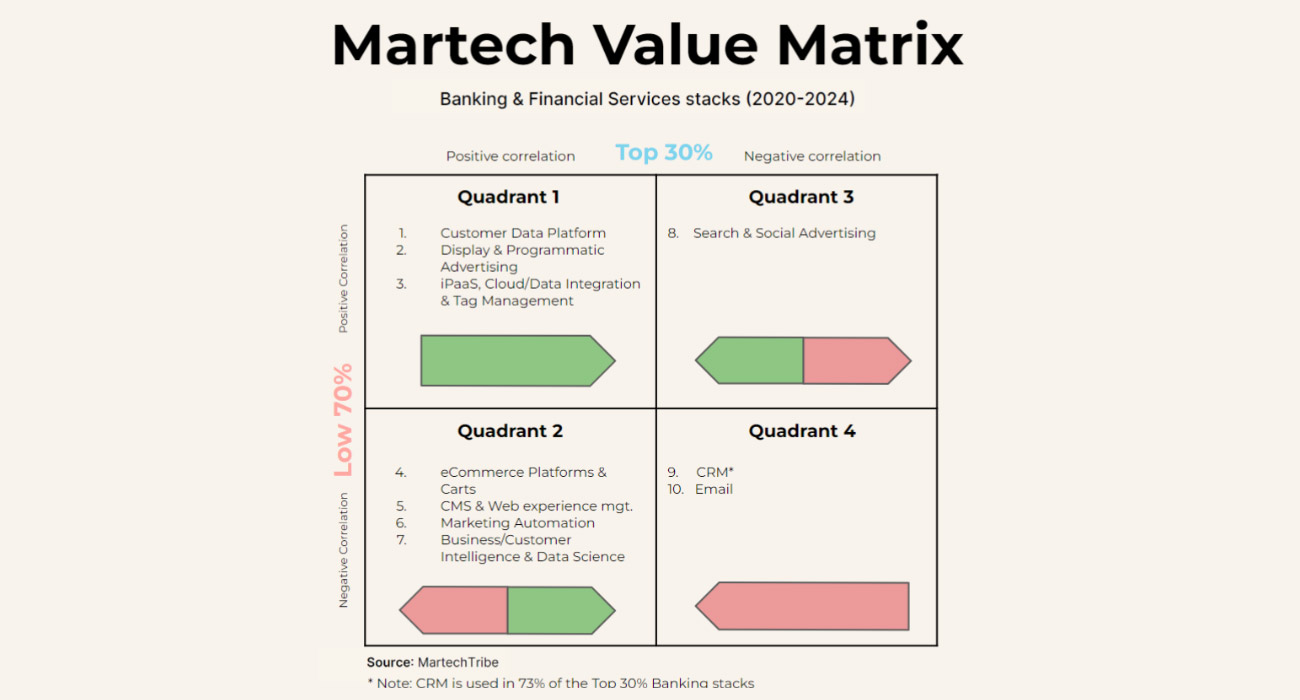
#MartechDay 2024 Keynote, Scott Brinker & Frans Riemersma., 7th May 2024, slide 69
Comparing positive and negative correlations of out- and low performers in a certain industry translates into a simple matrix with four quadrants. One of the immediate insights is that increasing martech maturity does not drive business value positively in all cases. This explains the enormous differences in success cases of specific martech between industries.
For instance, CRM works well in Consumer Goods; the correlations of out- and low performers are both positive for CRM. However, in Banking and Financial Services CRM out- and low performers have both negative correlations. In the Pharma industry, CRM outperformers show a positive correlation, but low performers do not.
The matrix for Banking and Financial Services stacks positions different martech in one of the four quadrants, each requiring a different approach to drive value.
Quadrant 1 – Both out- and low performers show a positive correlation between maturity and improved revenue/employee ratio. Martech in this quadrant can be called ‘High Flyers’, rolling solutions out and reaping the benefits is a relatively straightforward exercise.
Quadrant 2 – Outperformers show a positive correlation, low performers do not. If they increase their maturity their revenue/employee ratio decreases. Martech in this quadrant requires some homework before rolling it out, e.g. aligning goals, defining KPIs, use cases and key requirements, and growing skills.
Quadrant 3 – Outperformers show a negative correlation, but low performers do not. If they increase their maturity they improve their revenue/employee ratio. This martech has a positive impact initially, but less so when the company revenue/employee ratio improves.
Quadrant 4 – Both out- and low performers show a negative correlation between maturity and improved revenue/employee ratio. This does not mean you should avoid this martech. Take CRM for instance in this industry. 73% of the outperformers have kept a CRM in place. They use it in a piecemeal fashion on purpose. In this case, CRM is a “Negative Satisfier”. It is required-martech but comes with an over-engineering hazard.
Also Read: The Subscription Model is A Game of Balance
These insights help to have focused conversations about specific martech and find answers not available before. With client projects, we learned it helps to reduce the noise in martech conversations, which is helpful as there is a lot of anecdotal evidence in martech. Without these insights, companies will continue to suffer from the HSW syndrome, the Highest Salary Wins. And that syndrome is a big problem in martech because ”The client is not the user.” The client is the budget holder (C-level) and is normally not the actual user. That is a recipe for disaster, which leads to poor adoption, orphan licenses, shadow IT, etc.









 Microsoft Dynamics 365 represents a robust cloud-based CRM solution with features such as pipeline assessment, relationship analytics, and conversational intelligence. It utilises AI-powered insights to provide actionable intelligence via predictive analytics, lead scoring, sentiment analysis, etc. Currently, Microsoft operates in 190 countries and is made up of more than 220,000 employees worldwide.
 HubSpot is an inbound marketing, sales, and customer service software provider, offering robust CRM and automation solutions. Some of its products include Marketing Hub, Sales Hub, Operations Hub, Content Hub, Commerce Hub, Marketing Analytics and Dashboard Software. Guided by its inbound methodology, HubSpot enables companies to prioritise innovation and customer success.
 Monday.com is a project management software company, offering a cloud-based platform that enables businesses
  Headquartered in San Mateo, California, Freshworks is a global AI-powered business software provider. Its tech stack includes a scalable and comprehensive suite for IT, customer support, sales, and marketing teams, ensuring value for immediate business impact. Its product portfolio includes Customer Service Suite, Freshdesk, Freshchat, Freshcaller, Freshsuccess, and Freshservice. Freshservice for Business Teams has helped several global organisations to enhance their operational efficiency.
 Talkdesk offers an innovative AI-powered customer-centric tech stack to its global partners. The company provides generative AI integrations, delivering industry-specific solutions to its customers. Talkdesk CX Cloud and Industry Experience Clouds utilise modern machine learning and language models to enhance contact centre efficiency and client satisfaction.

 The company offers comprehensive cloud-based solutions, such as Microsoft Dynamics 365, Gaming Consoles, Microsoft Advertising, Copilot, among other things, to help organisations offer enhanced CX and ROI. Its generative-AI-powered speech and voice recognition solutions,such as Cortana and Azure Speech Services empowers developers to build intelligent applications.
 IBM is a global hybrid cloud and AI-powered
  Uniphore is an enterprise-class, AI-native company that was incubated in 2008. Its enterprise-class multimodal AI and data platform unifies all elements of voice, video, text and data by leveraging Generative AI, Knowledge AI, Emotion AI and workflow automation. Some of its products include U-Self Serve, U-Assist, U-Capture, and U-Analyze. Its Q for Sale is a conversational intelligence software that guides revenue teams with AI-powered insights, offering clarity on how to effectively keep prospects engaged.
 Google Cloud accelerates every organisation’s ability to digitally transform its business. Its enterprise-grade solutions leverage modern technology to solve the most criticial business problems
 8×8 offers out-of-the-box contact centre solutions, assisting all-size businesses to efficiently meet customer needs and preferences. It offers custom CRM integrations support and integrates effortlessly with third-party CRMs like Salesforce, Microsoft Dynamics, Zendesk, and more. Offering global support in all time zones & development teams in 5 continents, its patented geo-routing solution ensures consistent voice quality.
 Sprinklr is a comprehensive enterprise software company for all customer-focused functions. With advanced AI, Sprinklr’s unified customer experience management (Unified-CXM) platform lets organisations offer human experiences to every customer, every time, across any modern channel.
 Upland offers a comprehensive suite of contact centre and customer service solutions with products including InGenius, Panviva, Rant & Rave, and RightAnswers. InGenius enables organisations to connect their existing phone system with CRM, further enhancing agent productivity. Panviva provides compliant and omnichannel capabilities for highly regulated industries. Whereas, Rant & Rave, and RightAnswers are its AI-powered solutions,
  Zoho Social, a part of Zoho’s suite of 50+ products, is a comprehensive social media management platform for businesses and agencies. The Zoho Social dashboard includes a robust set of features, such as Publishing Calendar, Bulk Scheduler, and Approval Management to offer businesses all the essential social media publishing tools. Its monitoring tools help enterprises track and respond to relevant social conversations.
 Hootsuite, headquartered in Vancouver, is a social media management platform that streamlines the process of managing multiple social media accounts. Some of its core offerings include social media content planning and publishing, audience engagement tools, analytics and social advertising. Its easy-to-integrate capabilities help marketing teams to schedule and publish social media posts efficiently.
 Brandwatch enables businesses to build and scale the optimal strategy for their clients with intuitive, use-case-focused tools that are easy and quick to master. Bringing together consumer intelligence and social media management, the company helps its users react to the trends that matter, collaborate on data-driven content, shield the brand from threats and manage all the social media channels at scale.
 Zoho Corporation offers innovative and tailored software to help leaders grow their business. Zoho’s 55+ products aid sales and marketing, support and collaboration, finance, and recruitment requirements. Its customer analytics capabilities come with a conversational feature, Ask Zia. It enables users to ask questions and get insights in the form of reports and widgets in real-time.
 Salesforce-owned Tableau is an AI-powered analytics and business intelligence platform, offering the breadth and depth of capabilities that serve the requirements of global enterprises in a seamless, integrated experience. Marketers can utilise generative AI models, AI-powered predictions, natural language querying, and recommendationsons.
 Fullstory is a behavioural data platform, helping C-suite leaders make informed decisions by injecting digital behavioural data into its analytics stack. Its patented technology uncovers the power of quality behavioural data at scale, transforming every digital visit into actionable insights. Enterprises can increase funnel conversion and identify their highest-value customers effortlessly.
 Contentsquare is a cloud-based digital experience analytics platform, helping brands track billions of digital interactions, and turn those digital
  Amplitude is a product analytics platform, enabling businesses to track visitors with the help of collaborative analytics. The platform leverages the capabilities of
  Adobe Experience Cloud offers a comprehensive set of applications, capabilities, and services specifically designed to address day-to-day requirement for personalised customer experiences at scale. Its platform helps play an essential role in managing different digital content or assets to improve customer happiness. Its easy-to-optimise content gives users appropriate marketing streams, ensuring product awareness.
 Started in 2005 in a Sweden-based small town, Norrköping, Voyado offers a customer experience cloud platform that includes a customer loyalty management system. This platform helps businesses design and implement customer loyalty programs, track customer
  TapMango provides a comprehensive, customisable, flexible and feature-rich customer loyalty program. The loyalty tools include an integrated suite of customised consumer-facing technology, easy-to-use merchant tools, and automation algorithms, all aimed at enhancing customer experience. Adaptable to any industry, TapMango’s platform helps merchants compete with larger chains, converting customer one-time purchases into profitable spending habits.



 Adobe Experience Cloud offers a comprehensive set of applications, capabilities, and services specifically designed to address day-to-day requirements for personalised customer experiences at scale. Its innovative platform has played an essential role in managing different digital content or assets, to improve customer happiness or satisfaction. Some of its products include Adobe Gen Studio, Experience Manager Sites, Real-time CDP, and Marketo Engage.